A concept chart is a visual tool that organizes information and shows how different ideas relate to one another. It helps students, teachers, researchers, and professionals understand complex topics by breaking them into smaller concepts, categories, and supporting details.
Instead of presenting information as long paragraphs, a concept chart uses boxes, circles, connecting lines, labels, and examples to make relationships easier to understand. This visual structure can improve learning, support brainstorming, simplify problem-solving, and help people communicate ideas more clearly.
Whether you are studying a new subject, planning a project, or organizing information for a presentation, a concept chart template can provide a practical starting point. You can customize the layout, add related ideas, and use the finished chart as a study guide, planning document, or reference sheet.
What Is a Concept Chart?
A concept chart is a graphic organizer that arranges concepts into a structured visual format. It typically begins with a main topic and branches into related ideas, categories, supporting details, and examples.
The connections between concepts are an important part of the chart. Lines, arrows, and linking words can explain whether ideas belong together, depend on one another, share characteristics, or represent different parts of a larger subject.
For example, a student studying ecosystems might place “Ecosystem” in the main box and connect it to producers, consumers, and decomposers. Each category can then include examples, such as plants, animals, and fungi.
Concept charts are useful because they reveal the structure of information. Instead of memorizing isolated facts, users can see how individual ideas contribute to a broader topic.
Why Is a Concept Chart Important?
A well-organized concept chart makes complicated information easier to explore and communicate. It can support learning, planning, analysis, and collaboration in many different settings.
Improves Understanding
Breaking a large topic into smaller sections helps users understand its essential parts. A visual structure also makes it easier to identify the main idea and distinguish it from supporting information.
Reveals Relationships Between Ideas
A concept chart shows how concepts connect rather than presenting them as unrelated facts. These connections can reveal patterns, similarities, dependencies, and cause-and-effect relationships.
Supports Memory and Learning
Creating a chart requires users to select information, group related ideas, and explain their connections. This active process can support deeper learning and make information easier to review later.
Encourages Critical Thinking
Organizing concepts helps users compare information, identify gaps, and question assumptions. Students can use charts to analyze a subject, while professionals can use them to explore challenges and evaluate possible solutions.
Makes Communication Clearer
A visual chart can communicate an idea more quickly than a long explanation. It provides a shared reference that helps teams, students, and audiences follow complex information.
Printable Concept Chart Template
A printable concept chart template provides a ready-made structure for organizing a main topic, related concepts, supporting details, and examples. Instead of drawing every box and connection from scratch, you can use the existing layout and focus on the information.
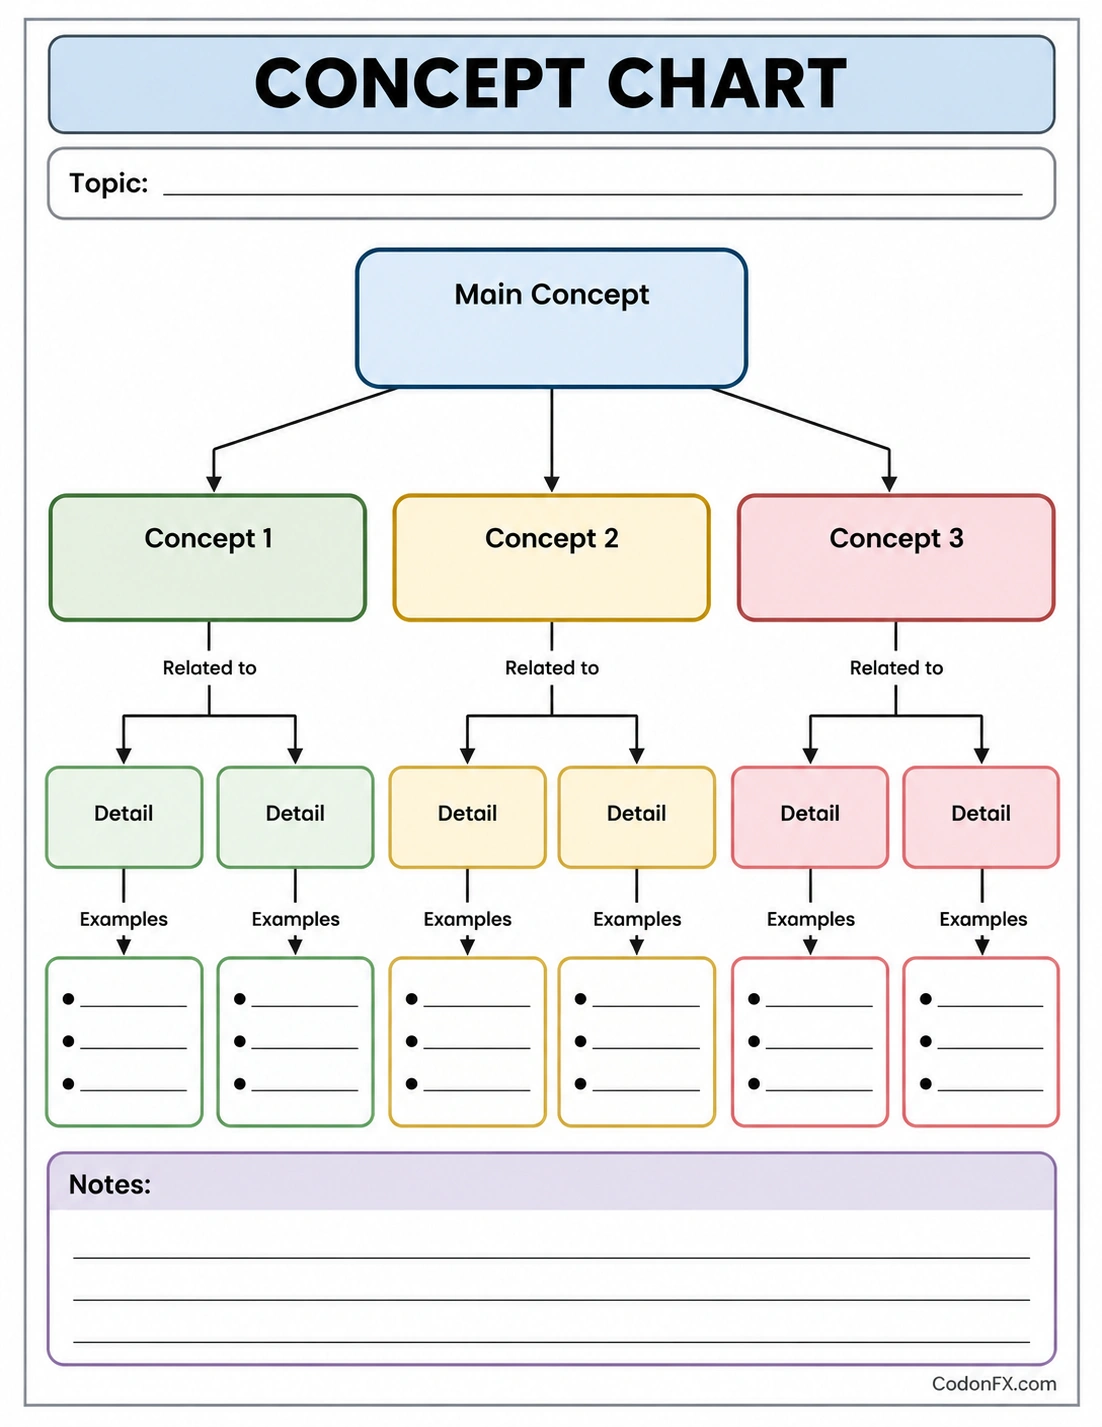
The template includes a topic line at the top, a central concept box, three related concept sections, and smaller spaces for details and examples. A notes area at the bottom provides room for extra information or questions.
You can print the chart on US Letter paper or recreate the layout in a document editor. For the best results, keep labels short and use the available writing spaces to record only the most relevant information.
Key Elements of a Concept Chart
Although concept charts can use different layouts, most include several basic elements that help organize information.
Main Concept
The main concept is the central topic the chart explains. It should be specific enough to guide the rest of the chart without becoming too narrow to support related ideas.
For example, “Renewable Energy” is a useful main concept for a chart about solar power, wind power, hydropower, and other renewable sources.
Related Concepts
Related concepts are the main categories or ideas connected to the central topic. They divide a broad subject into manageable sections and help establish the chart’s overall structure.
Connecting Lines and Arrows
Lines and arrows show which concepts are connected. Their direction can indicate a sequence, hierarchy, or relationship between ideas.
When the relationship is not obvious, add linking words such as “includes,” “causes,” “depends on,” or “is an example of.” These labels help readers understand why two concepts are connected.
Supporting Details
Supporting details provide definitions, characteristics, explanations, or other information about each concept. Keep them concise so the chart remains easy to scan.
Examples
Examples connect abstract ideas to specific situations or objects. They can make unfamiliar concepts easier to understand and help readers apply what they have learned.
Notes Section
A notes section provides space for questions, additional observations, definitions, or information that does not fit neatly into the main chart. It can also serve as a place to record ideas that need further research.
How to Create a Concept Chart Step by Step
Creating a useful concept chart begins with a clear purpose. Follow these steps to turn a complex topic into an organized visual guide.
Choose a Main Topic
Start with the subject you want to explain, study, or analyze. Write the main concept at the top or in the central box, depending on your chosen layout.
For example, if you are studying the human body, you might use “Human Body Systems” as your main topic.
Identify the Major Concepts
List the most important ideas related to the topic. Group similar ideas together and choose a few major categories that can organize the remaining information.
For a chart about the human body, major concepts might include the circulatory system, respiratory system, digestive system, and nervous system.
Add Supporting Details
Include important facts, definitions, functions, or characteristics beneath each related concept. Use short phrases rather than lengthy paragraphs to keep the chart readable.
Connect Related Ideas
Draw lines or arrows between concepts that share a meaningful relationship. Add linking words where necessary to clarify the connection.
For example, a chart about plant growth might connect “Sunlight” to “Photosynthesis” and then connect “Photosynthesis” to “Plant Growth.”
Include Relevant Examples
Add examples that explain how each concept works in practice. Examples can include real-world situations, specific objects, short case studies, or familiar applications.
Review and Improve the Layout
Check that the chart follows a logical structure and that every connection has a clear purpose. Remove repeated information, simplify long labels, and make sure the most important ideas are easy to find.
Concept Chart Examples for Different Purposes
Concept charts can be adapted to many subjects and activities. The best structure depends on the information you need to organize and the relationships you want to show.
Concept Chart for Students
Students can use a concept chart to summarize lessons, prepare for exams, or explore unfamiliar subjects. A science student might organize the topic “Matter” into solids, liquids, and gases, then list the characteristics and examples of each state.
This approach provides a visual study guide that can be reviewed before a test or used to identify concepts that need more attention.
Concept Chart for Teachers
Teachers can use concept charts to introduce a new unit, summarize a lesson, or assess students’ understanding. A partially completed chart can also become a classroom activity in which students fill in missing concepts and connections.
Concept Chart for Project Planning
Professionals can use a concept chart to organize project goals, major work areas, supporting tasks, and dependencies. For example, a product launch chart might connect the main goal to research, design, marketing, production, and distribution.
For detailed scheduling, ownership, and deadlines, a project plan or project tracker can complement the chart.
Concept Chart for Brainstorming
During brainstorming, a concept chart helps teams group ideas, identify common themes, and explore relationships. Start with a central challenge, then branch into possible causes, opportunities, resources, and solutions.
Concept Chart for Comparing Ideas
A concept chart can organize similarities and differences between two or more concepts. For example, a student might compare renewable and nonrenewable energy by recording their sources, advantages, limitations, and environmental effects.
Concept Chart vs. Other Graphic Organizers
Concept charts are related to other visual learning tools, but each format serves a slightly different purpose.
- Concept chart: Organizes concepts and shows relationships between them, often using labeled connections and supporting examples.
- Mind map: Commonly begins with a central idea and branches outward to capture related thoughts and associations.
- Flowchart: Shows steps, decisions, or the sequence of a process.
- Venn diagram: Highlights similarities and differences between two or more groups.
- Comparison chart: Organizes features of multiple items into rows or columns for easy comparison.
- Timeline: Arranges events in chronological order.
Choose the format that matches your goal. A concept chart is especially useful when understanding relationships between ideas matters more than following a strict sequence of steps.
Tips for Making an Effective Concept Chart
A clear chart should make information easier to understand rather than add unnecessary complexity. Use these practical tips to improve your layout.
- Keep the main topic focused: Choose one clear subject so the chart has a consistent purpose.
- Use concise labels: Short phrases are easier to read than full paragraphs.
- Group related ideas: Place concepts together when they share a meaningful connection.
- Label important relationships: Use linking words when lines alone do not explain the connection.
- Use color consistently: Assign colors to categories when they improve readability, but avoid excessive decoration.
- Include useful examples: Choose examples that explain the concepts rather than simply filling empty spaces.
- Leave enough space: Avoid overcrowding the chart with too many ideas or connections.
- Review accuracy: Check definitions, relationships, and examples before sharing or printing the chart.
Common Concept Chart Mistakes to Avoid
Some chart designs become difficult to understand because they include too much information or fail to explain the relationships between concepts.
- Adding too many concepts: Focus on the most important ideas and create a separate chart for additional details if necessary.
- Using unclear connections: Label lines or arrows when the relationship between concepts is not obvious.
- Repeating information: Avoid copying the same details into multiple sections without a clear reason.
- Mixing unrelated categories: Group concepts according to consistent criteria.
- Ignoring the audience: Adjust terminology and detail to the reader’s knowledge level.
- Skipping the review: Check that the chart is accurate, logically organized, and easy to follow.
Frequently Asked Questions About Concept Charts
What is the main purpose of a concept chart?
The main purpose of a concept chart is to organize information visually and show relationships between concepts. It helps users understand complex subjects, compare ideas, identify connections, and communicate information more clearly.
How is a concept chart different from a mind map?
A concept chart often emphasizes clearly defined relationships between concepts, including labeled connections and supporting details. A mind map commonly branches outward from a central topic to capture associations and ideas. Both tools can support brainstorming and learning.
Can students use a concept chart for studying?
Yes. Students can use concept charts to summarize lessons, organize definitions, connect related ideas, and prepare for exams. Creating the chart can also help identify topics that require further review.
What should be included in a concept chart?
A concept chart typically includes a main concept, related concepts, connecting lines or arrows, supporting details, and relevant examples. A notes section can provide extra space for questions or additional information.
Can I use a printable concept chart template?
Yes. A printable concept chart template provides a ready-made layout for organizing a topic and its related ideas. You can fill it in by hand or adapt the structure in a compatible digital document editor.
How many concepts should a chart contain?
There is no fixed number. Include enough concepts to explain the topic clearly without overcrowding the layout. For a simple worksheet, starting with three to five major concepts can be manageable, but more complex subjects may require additional sections.
Are concept charts useful in the workplace?
Yes. Professionals can use concept charts to organize project ideas, explain systems, analyze problems, plan presentations, and communicate relationships between business concepts.
Can a concept chart improve memory?
A concept chart can support learning by helping users organize information, connect ideas, and review material visually. Its effectiveness depends on the topic, the quality of the relationships, and how actively the user engages with the information.
Conclusion
A concept chart is a practical visual organizer that makes complex information easier to understand by showing how ideas connect. It can support learning, brainstorming, problem-solving, project planning, and communication across educational and professional settings.
Using a concept chart template can save time and provide a consistent structure for the main topic, related concepts, supporting details, and examples. Choose a clear subject, organize the most important ideas, label meaningful connections, and review the finished chart for accuracy.
Whether you are a student preparing for an exam, a teacher explaining a lesson, or a professional organizing a project, a well-designed concept chart can turn scattered information into a clearer and more useful visual guide.
Download: Concept Chart Template
