Gantt charts have become an integral part of project management, allowing teams to effectively plan, organize, and track their projects. Whether you are a project manager, team lead, or individual contributor, understanding Gantt charts can greatly enhance your ability to manage and execute projects successfully.
In this article, we will explore the ins and outs of Gantt charts, from their definition and purpose to their benefits and how to create one. So, let’s dive in and discover everything you need to know about Gantt charts.
What is a Gantt Chart?
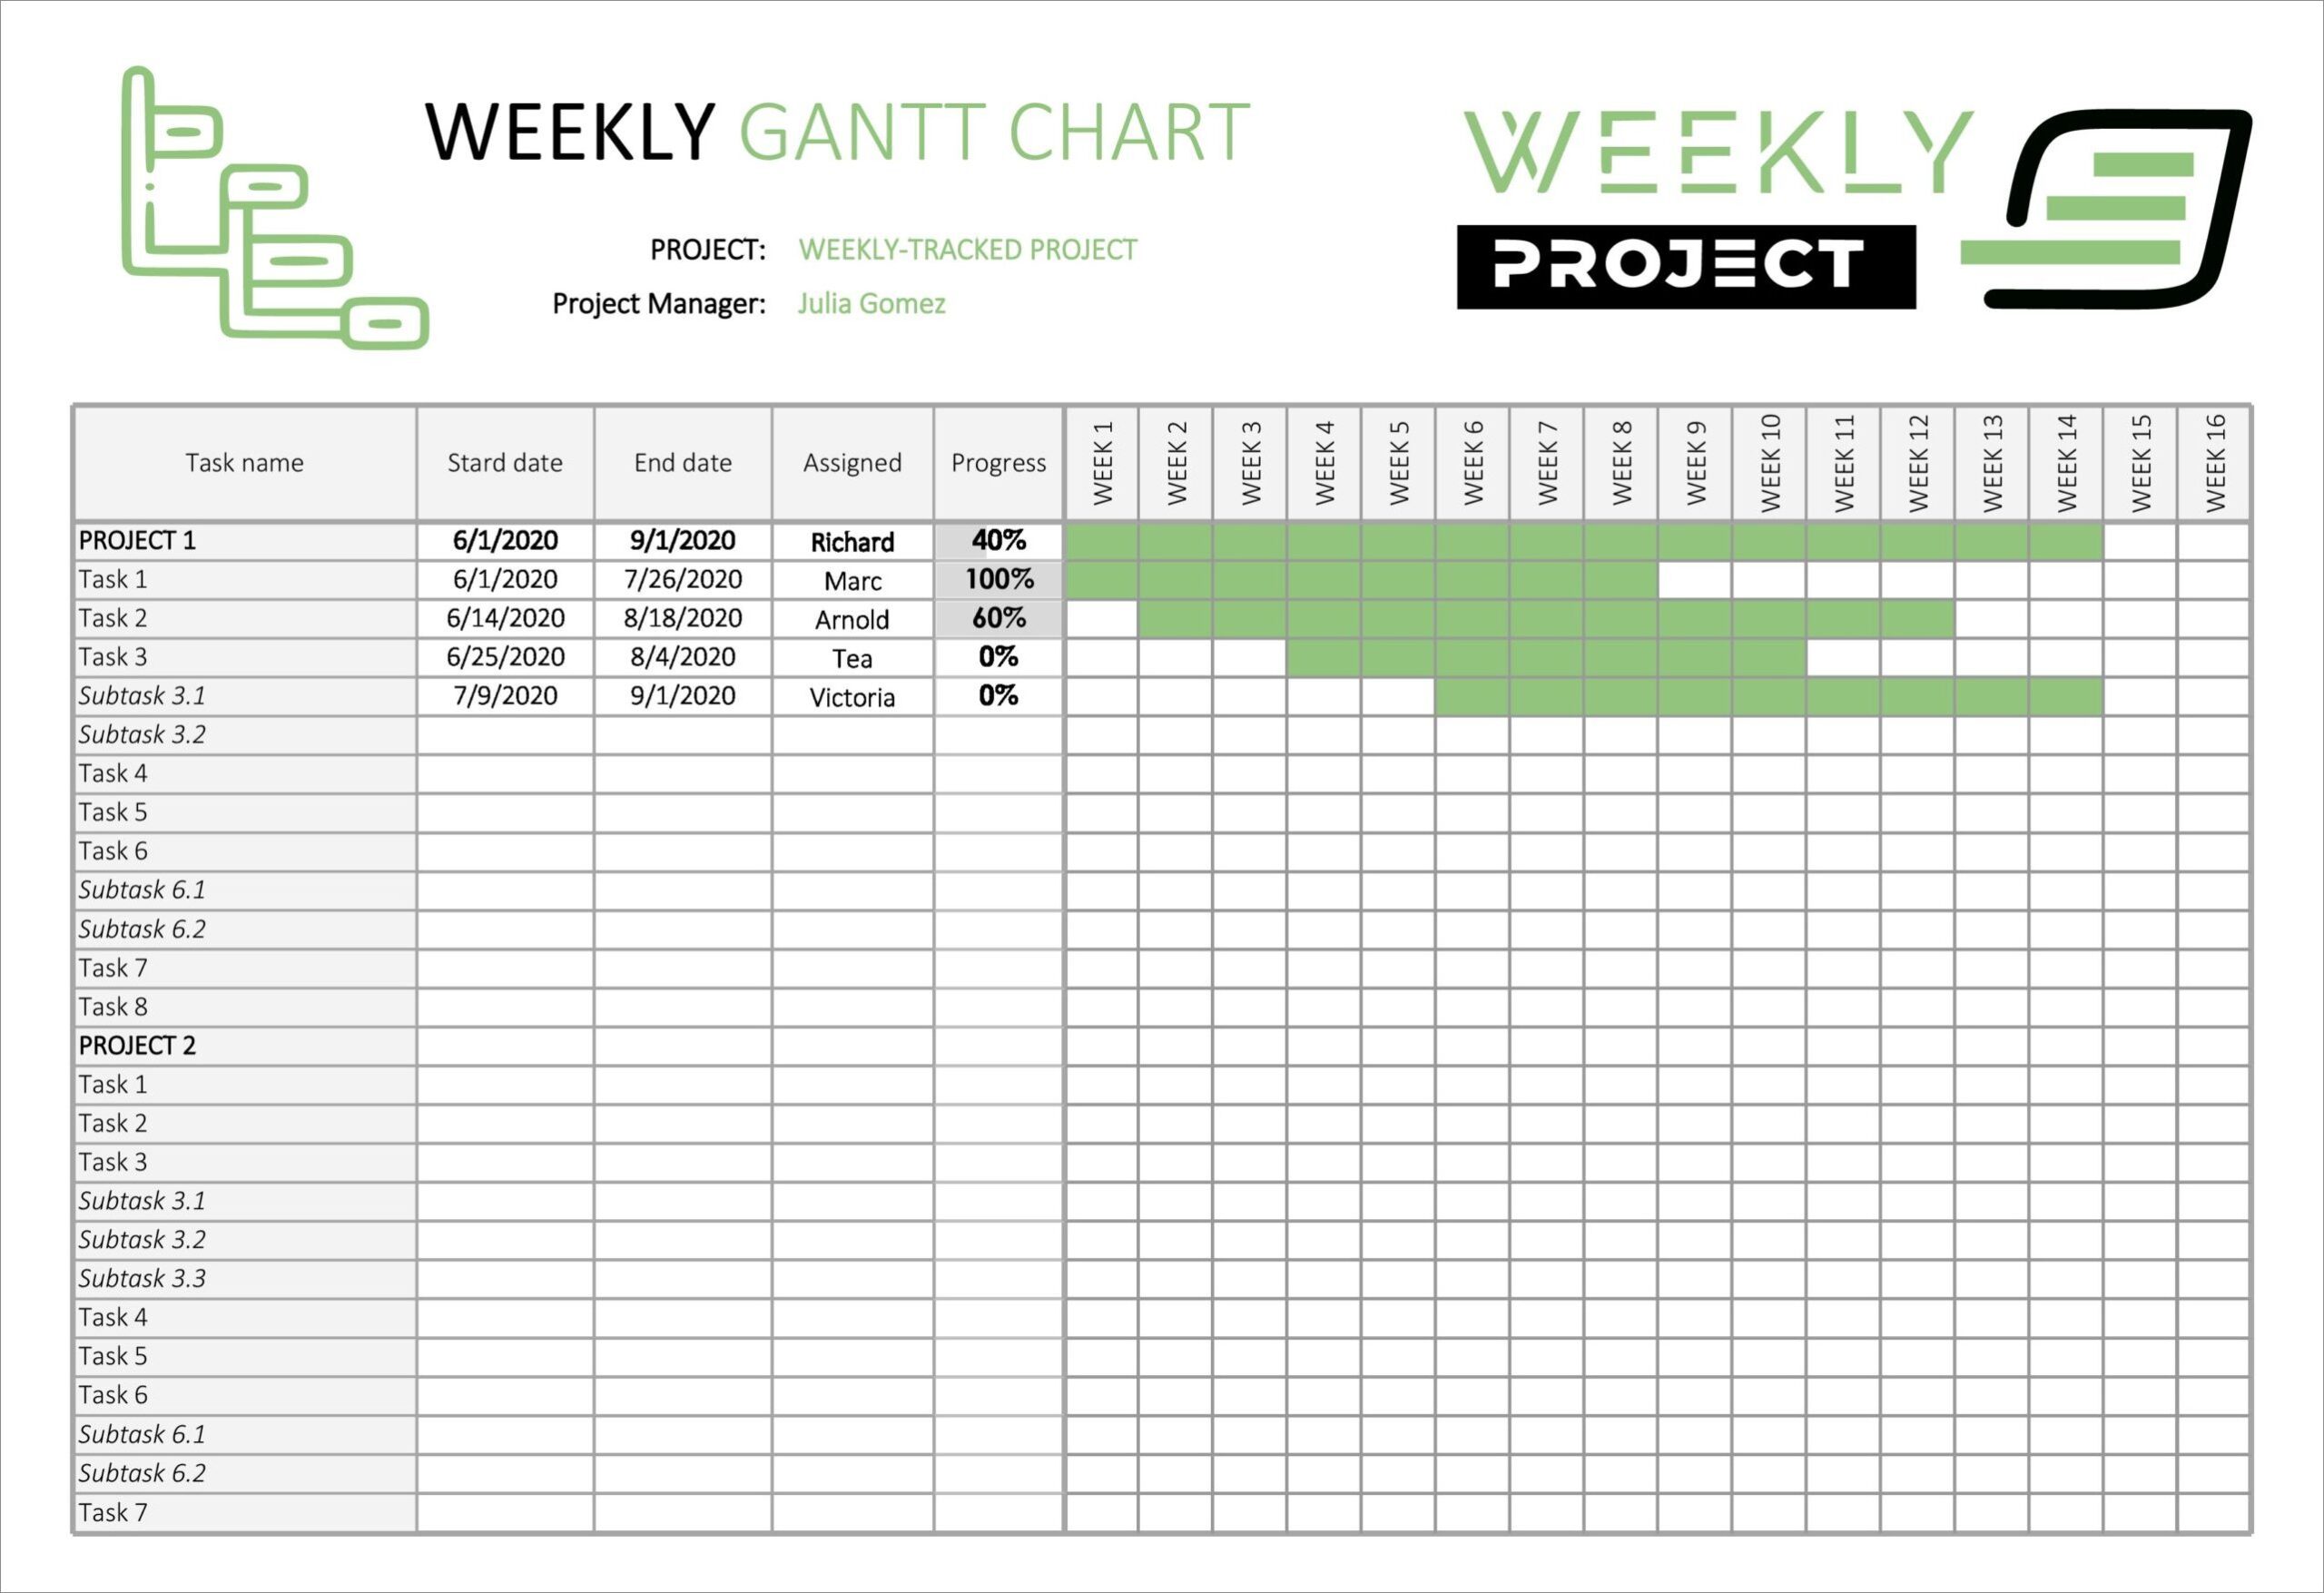
A Gantt chart is a visual representation of a project schedule that breaks it down into specific tasks, their durations, and the dependencies between them. It provides a timeline view of the project, allowing project managers and team members to see the start and end dates of each task, the overall project timeline, and the critical path. The chart is named after Henry Gantt, an American engineer and management consultant who first introduced it in the early 20th century.
Gantt charts are widely used in project management as they provide a clear and organized view of the project’s progress. They enable teams to plan and schedule tasks, allocate resources, track progress, and identify any potential bottlenecks or delays. By visualizing the project timeline, Gantt charts help in coordinating and communicating project activities, ensuring everyone is on the same page.
How Does a Gantt Chart Work?
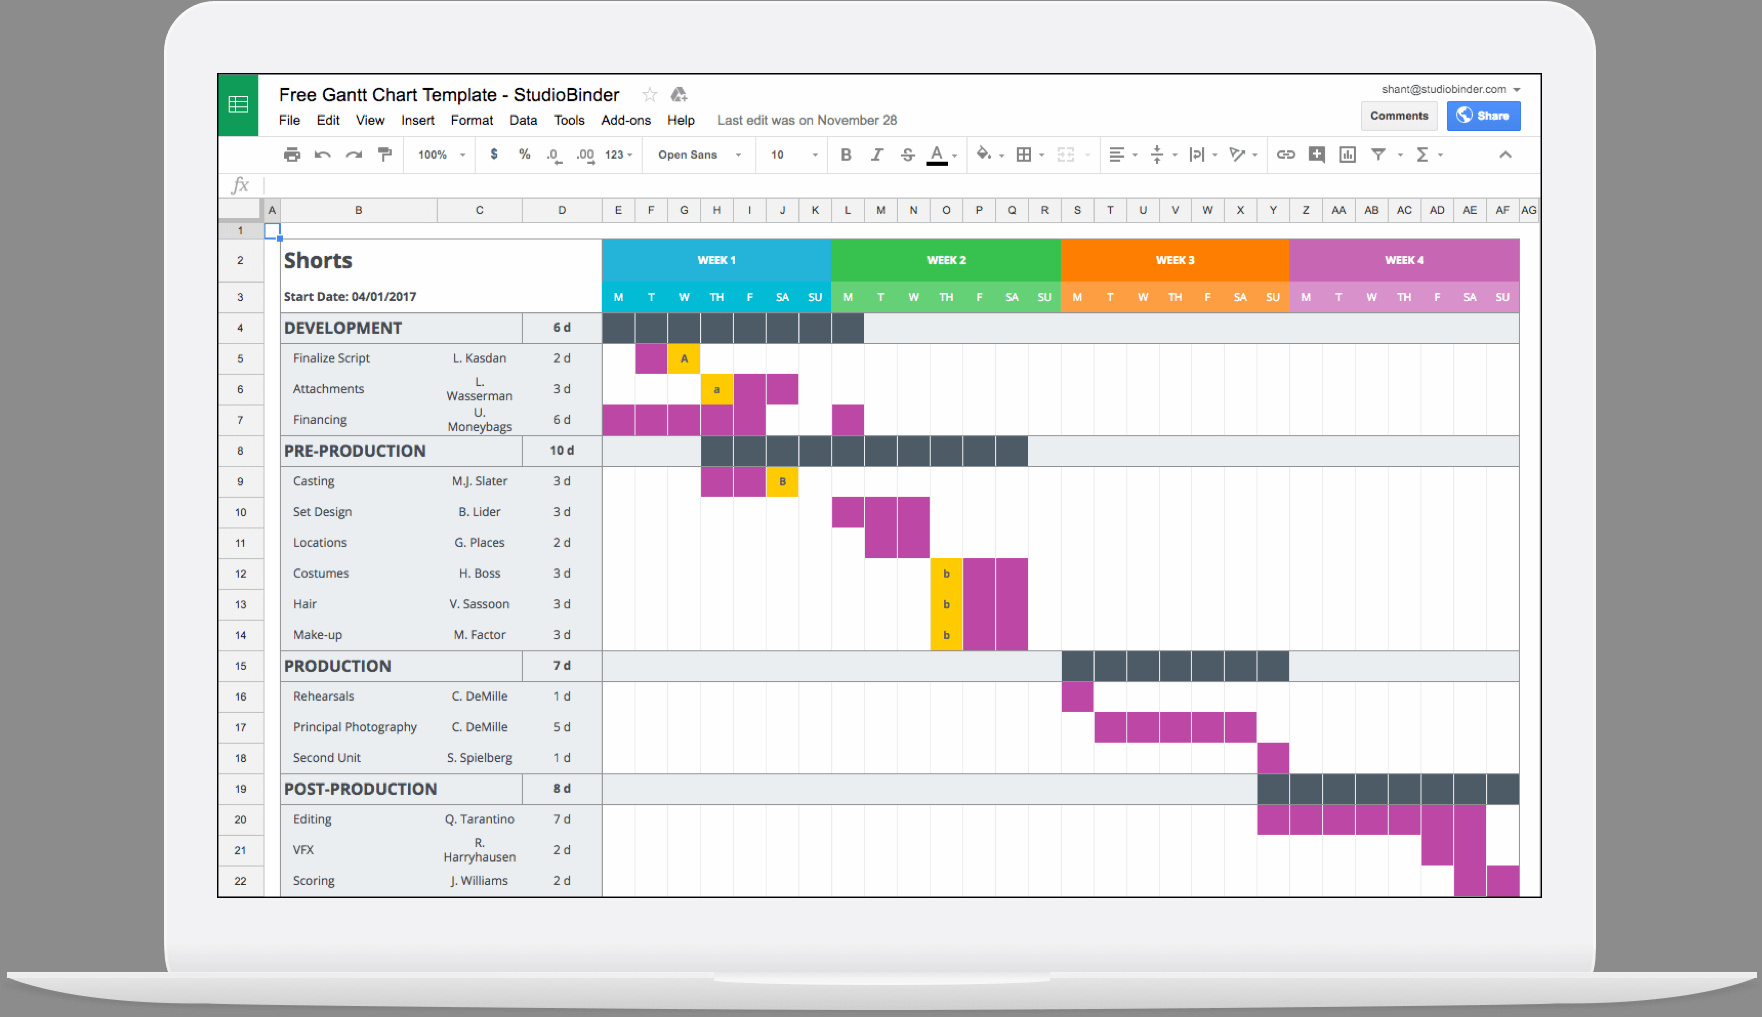
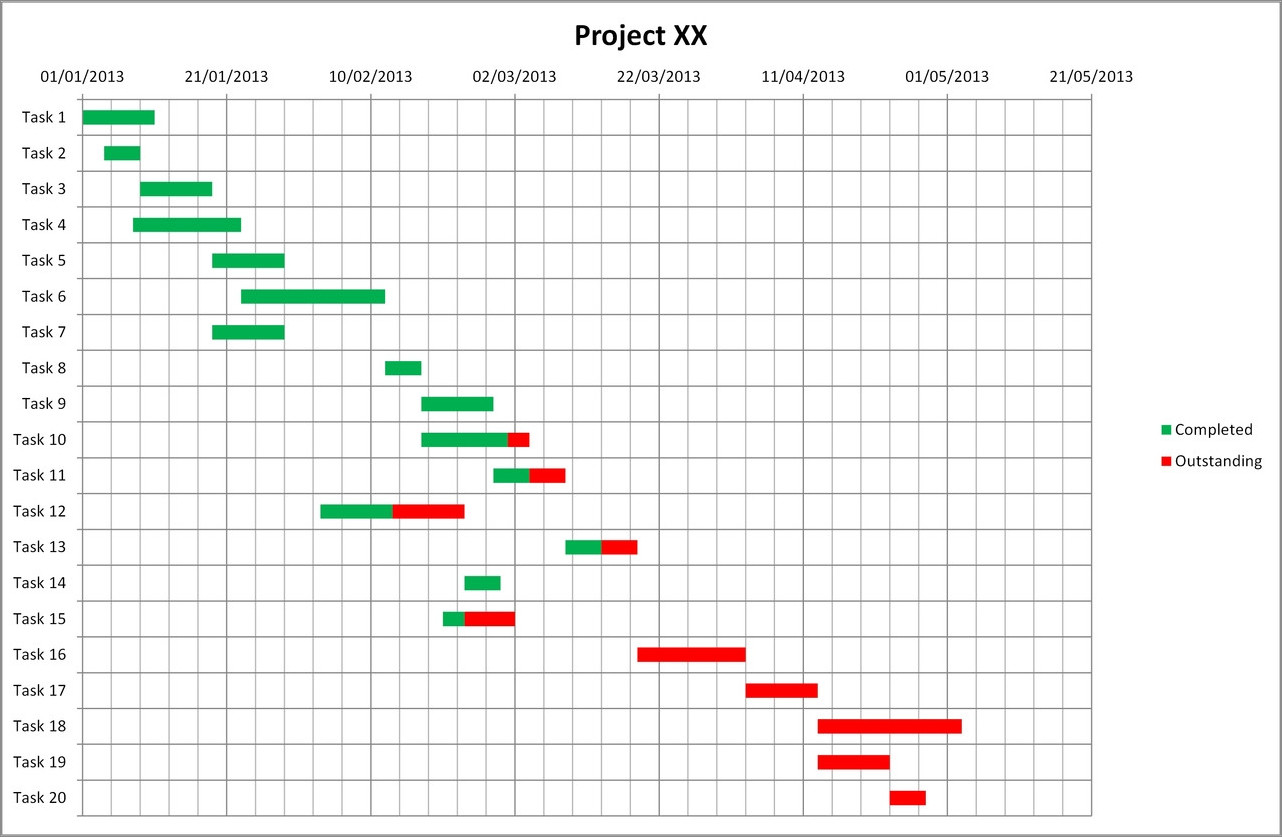
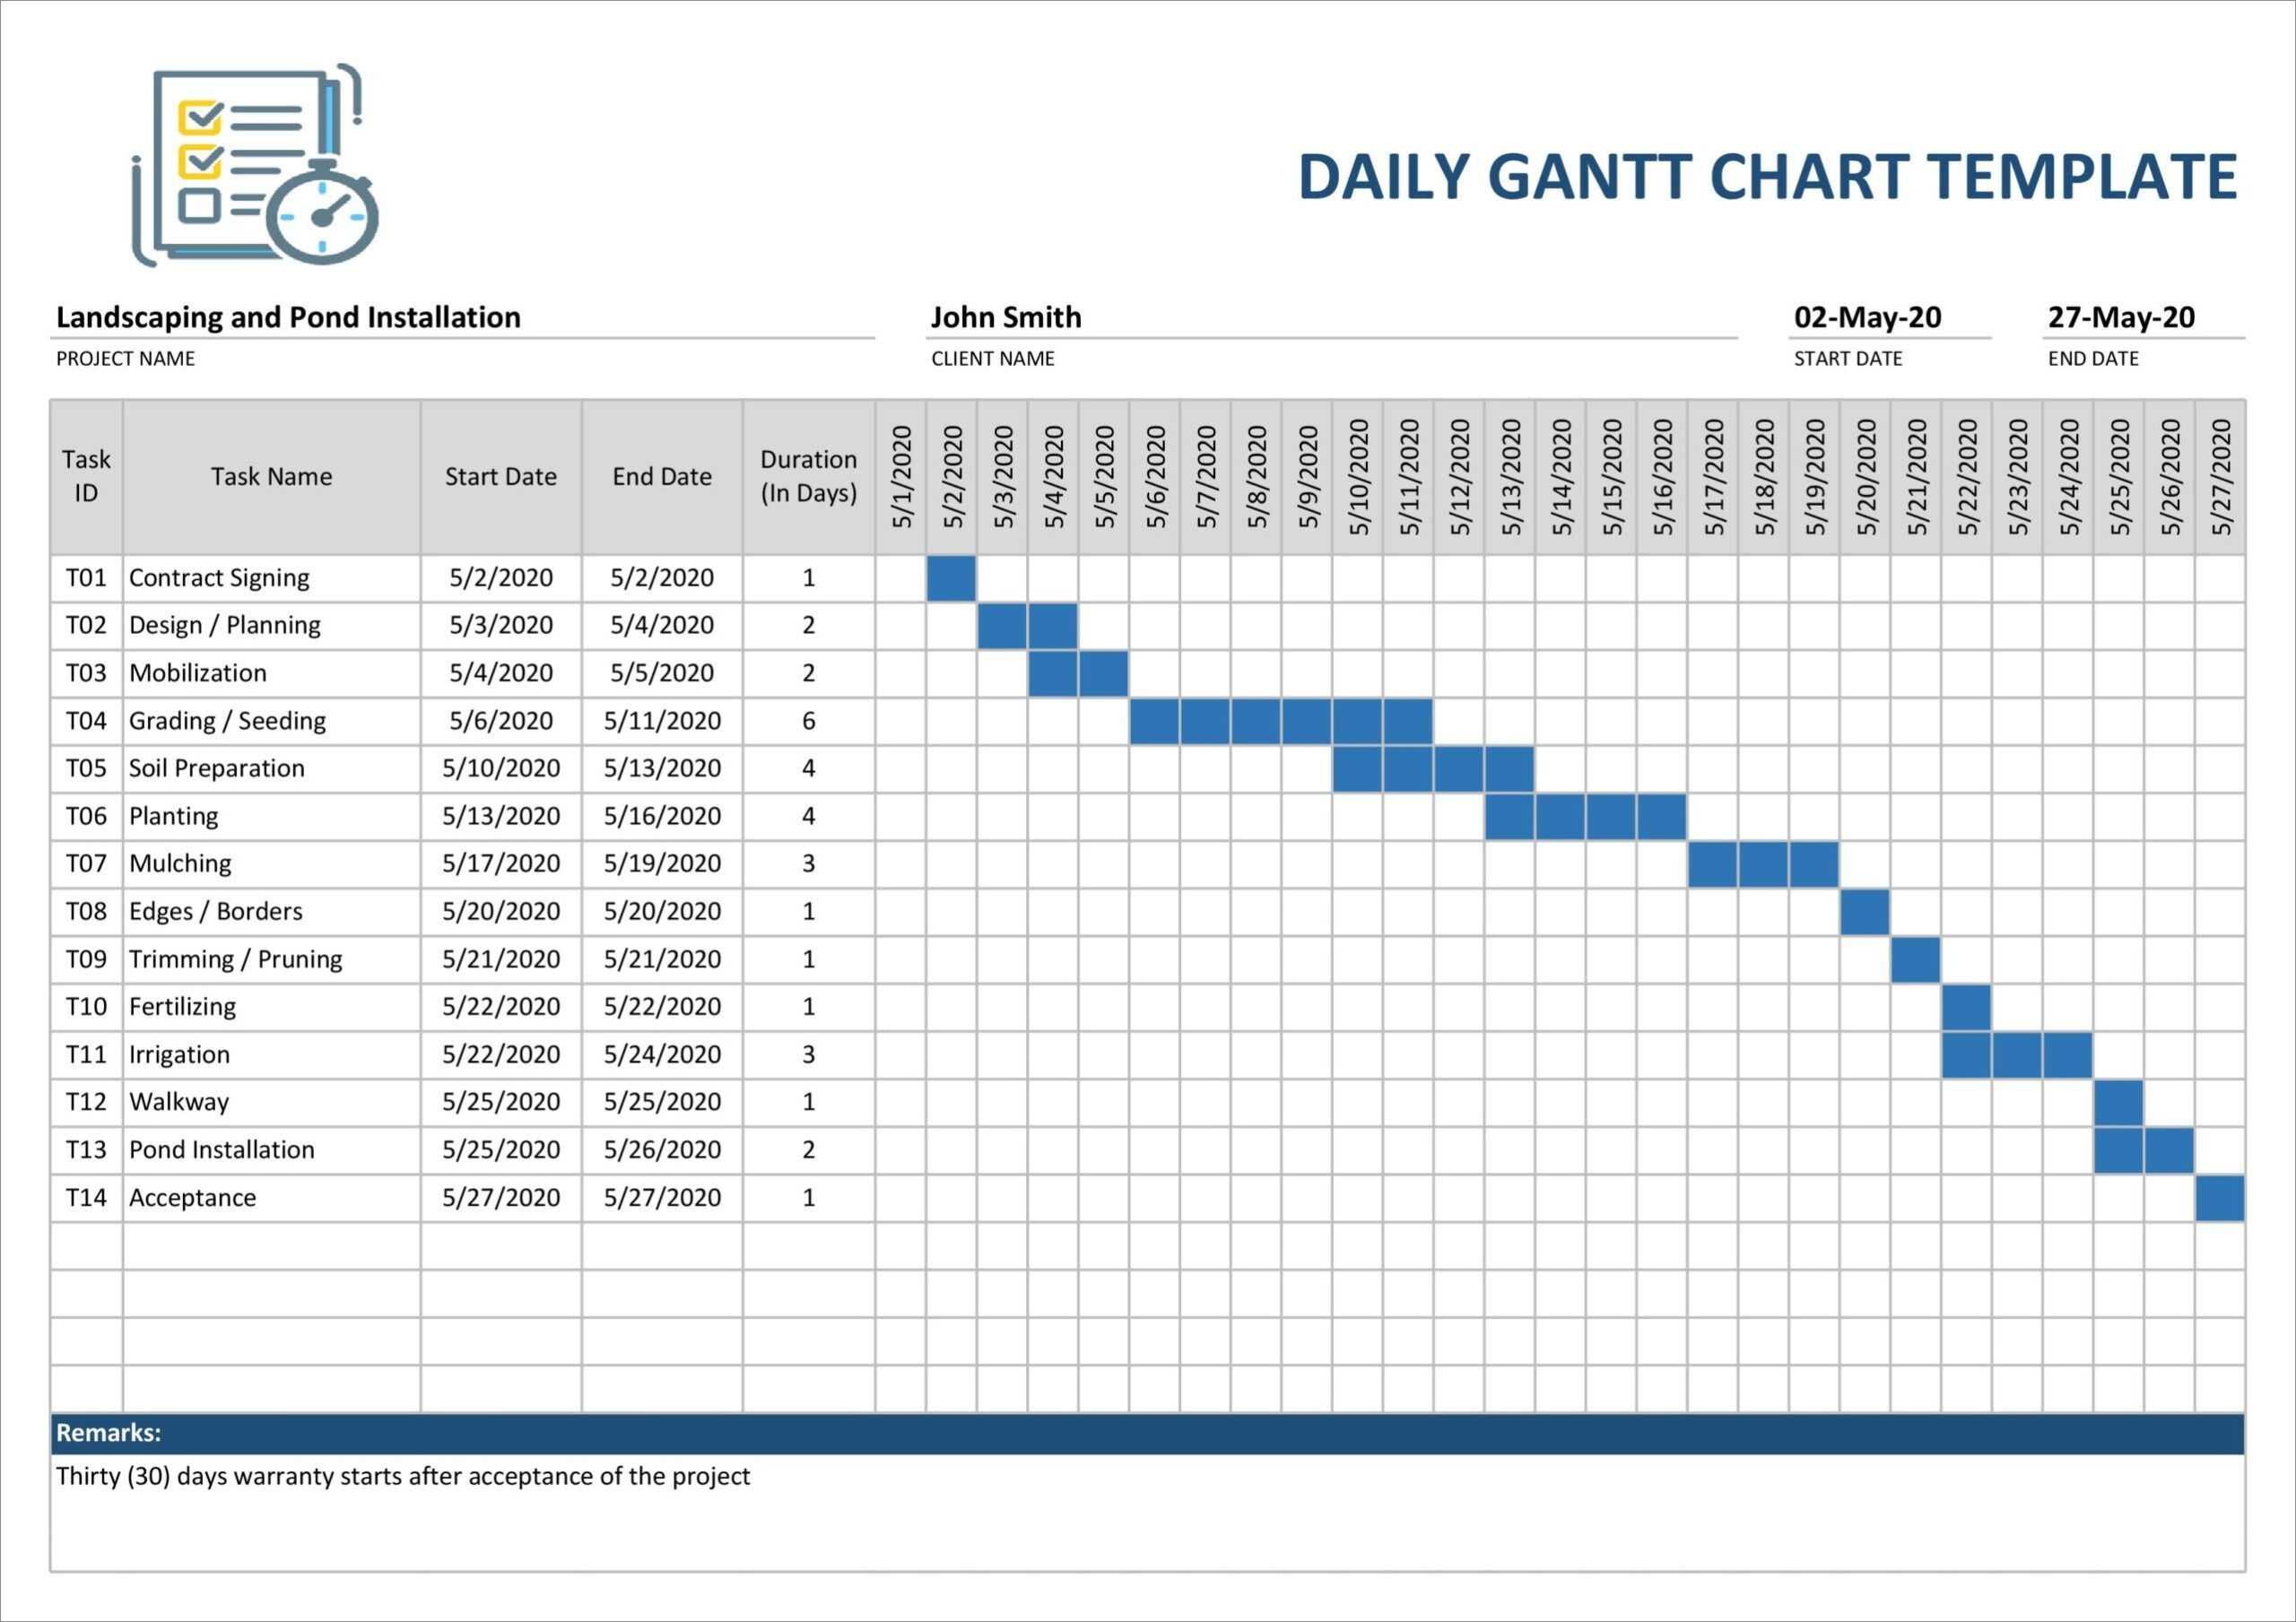
A Gantt chart typically consists of a horizontal timeline at the top, with individual tasks represented as bars along the timeline. The length of each bar represents the duration of the task, and the position of the bar indicates its start and end dates. Tasks can be linked together using dependencies, which represent the relationships between tasks, such as “Task B can’t start until Task A is completed.”
The Gantt chart also includes other important elements, such as milestones, which are significant events or goals within the project, and the critical path, which is the longest sequence of dependent tasks that determines the shortest possible project duration. Overall, the chart provides a comprehensive overview of the project’s timeline, tasks, and their interdependencies.
Benefits of Using Gantt Charts
Gantt charts offer numerous benefits to project managers and teams:
- Visualization: Gantt charts provide a visual representation of the project, making it easier to understand and communicate the project timeline and tasks.
- Task Dependencies: By linking tasks with dependencies, Gantt charts help in identifying the critical path and understanding the impact of delays on the overall project timeline.
- Resource Allocation: Gantt charts allow project managers to allocate resources efficiently by visualizing the workload and identifying potential resource conflicts.
- Progress Tracking: With Gantt charts, it’s easy to track the progress of each task and the overall project, ensuring that everything is on track and schedule.
- Communication: Gantt charts serve as a valuable communication tool, enabling project managers to share project status updates with stakeholders and team members.
- Risk Management: By visualizing the project timeline and dependencies, Gantt charts help in identifying potential risks and developing contingency plans.
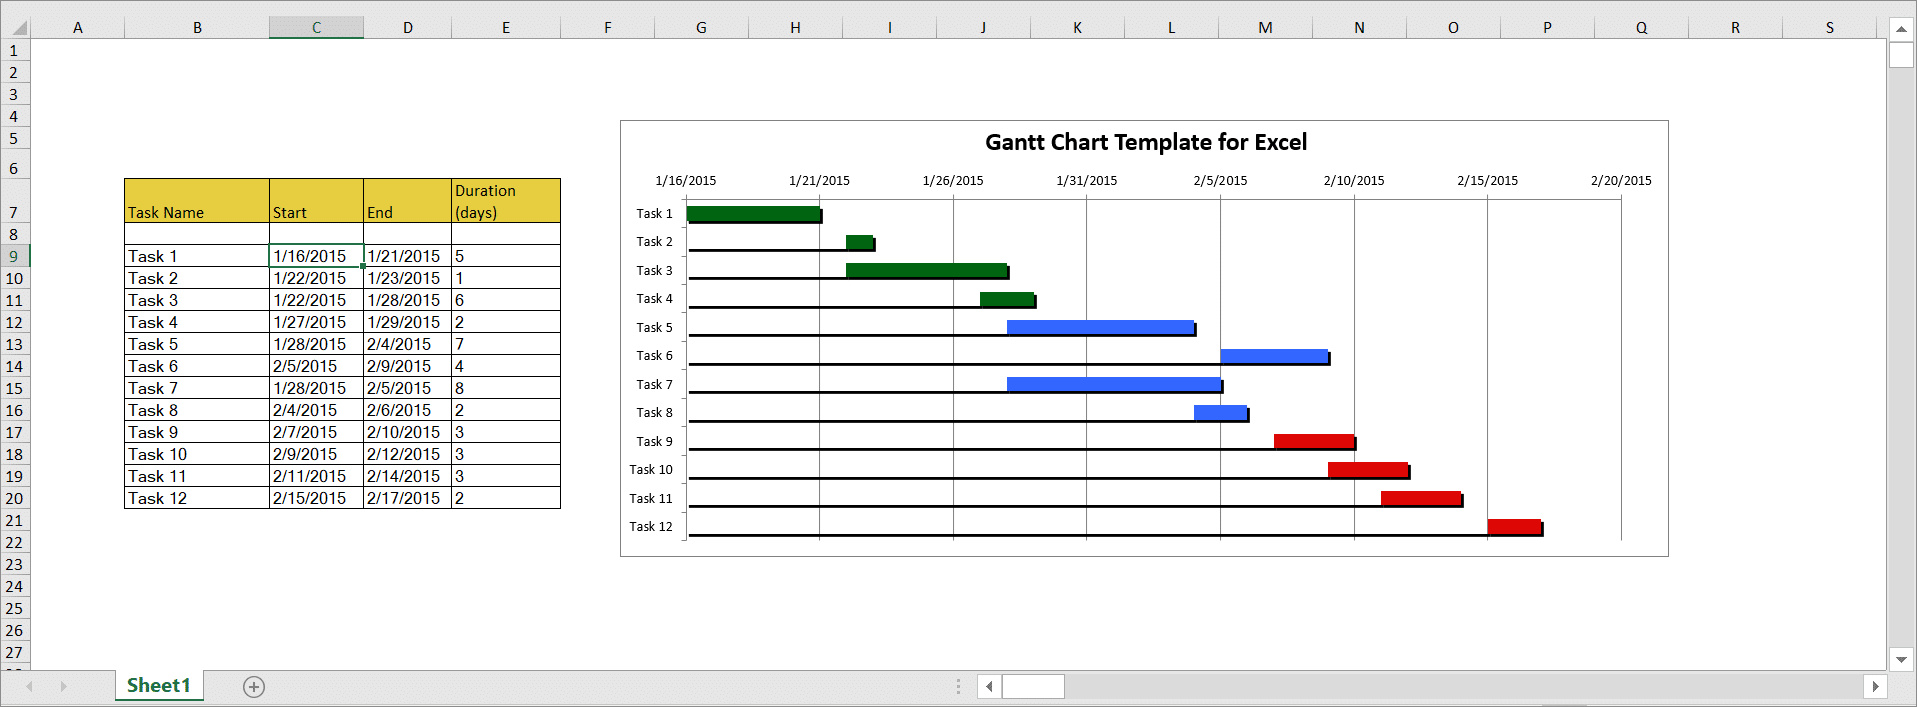
How to Create a Gantt Chart
Creating a Gantt chart is a straightforward process. Here are the steps to follow:
1. Define the Project Tasks
Start by identifying all the tasks required to complete the project. Break them down into smaller, manageable units.
2. Determine Task Durations
Estimate the time it will take to complete each task. Be realistic and consider factors such as complexity, available resources, and dependencies.
3. Establish Task Dependencies
Identify the relationships between tasks, such as which tasks need to be completed before others can begin. This will help in creating a logical sequence of tasks.
4. Create the Gantt Chart
Using a Gantt chart software or tool, input the tasks, durations, and dependencies to create the chart. Adjust the timeline and bar lengths accordingly.
5. Add Milestones and Critical Path
Include milestones to mark significant events or goals within the project. Identify the critical path to understand the tasks that must be completed on time to avoid project delays.
6. Update and Track Progress
Regularly update the Gantt chart to reflect the actual progress of tasks. This will help in tracking the project’s status and identifying any deviations from the original plan.
7. Share and Communicate
Share the Gantt chart with stakeholders and team members to keep everyone informed about the project’s progress. Use it as a communication tool to provide updates and discuss any changes or issues.
Conclusion
Gantt charts are an essential tool for project management, providing a visual representation of tasks, timelines, and dependencies. By using Gantt charts, project managers and teams can effectively plan, track, and communicate project progress. Remember to choose the right Gantt chart software or tool that suits your needs and preferences. So, start utilizing Gantt charts to enhance your project management skills and achieve project success.
Gantt Chart Template Excel – Download
