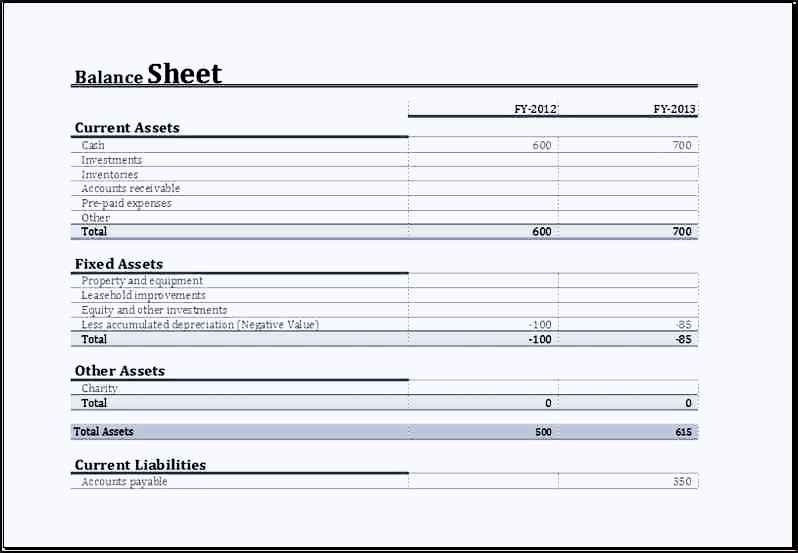
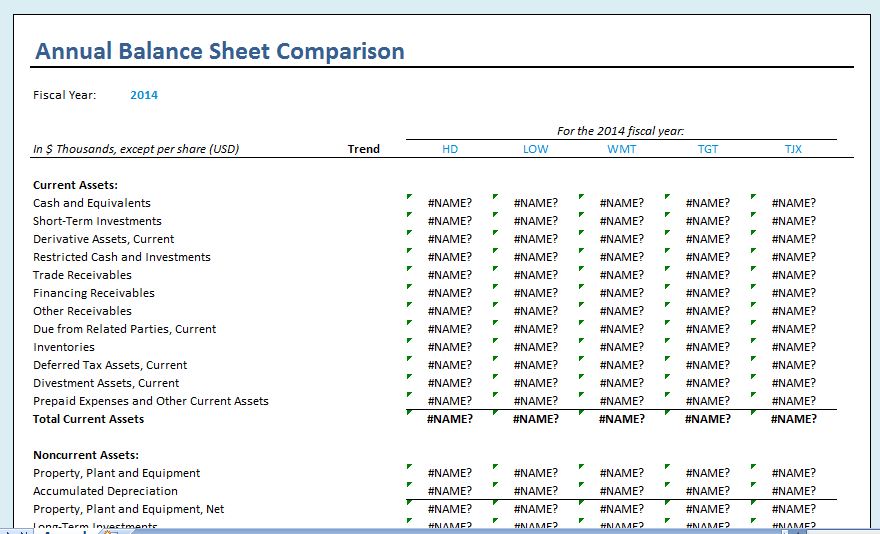
In the world of finance, yearly comparison balance sheets play a crucial role in helping stakeholders analyze a company’s financial health and performance over time. These balance sheets compare a company’s financial position, including its assets, liabilities, and equity, across two or more periods, typically two consecutive years.
By examining these balance sheets, stakeholders can identify trends, areas for improvement, or potential concerns that may impact the company’s long-term success.
What is a Yearly Comparison Balance Sheet?
A yearly comparison balance sheet is a financial statement that provides a snapshot of a company’s financial position at a specific point in time. By comparing these balance sheets across multiple years, stakeholders can gain insights into how the company’s financial health has evolved.
This allows for a deeper understanding of the company’s performance, profitability, and overall financial stability.
Why Use Yearly Comparison Balance Sheets?
Yearly comparison balance sheets are essential for stakeholders, including investors, creditors, and management, to assess a company’s financial performance and make informed decisions.
By comparing balance sheets from different periods, stakeholders can track changes in the company’s assets, liabilities, and equity and identify any significant shifts that may impact the company’s financial health. This information is crucial for evaluating the company’s long-term sustainability and growth potential.
How to Analyze Yearly Comparison Balance Sheets
Analyzing yearly comparison balance sheets requires a thorough understanding of financial statements and accounting principles. Stakeholders should pay attention to key metrics such as liquidity ratios, profitability ratios, and solvency ratios to assess the company’s financial strength and performance over time.
By comparing these ratios across different periods, stakeholders can identify trends, anomalies, and areas for improvement or concern.
- Liquidity Ratios: Liquidity ratios measure a company’s ability to meet its short-term obligations with its current assets. A higher liquidity ratio indicates better financial health and stability.
- Profitability Ratios: Profitability ratios assess a company’s ability to generate profits from its operations. Stakeholders should analyze trends in profitability ratios to gauge the company’s overall financial performance.
- Solvency Ratios: Solvency ratios evaluate a company’s ability to meet its long-term debt obligations. By comparing solvency ratios across different periods, stakeholders can assess the company’s financial viability and sustainability.
Examples of Yearly Comparison Balance Sheets
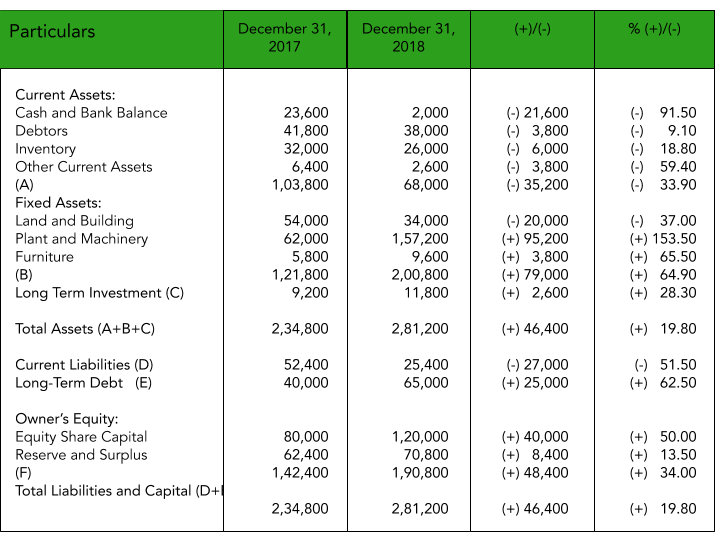
To better understand how yearly comparison balance sheets work, let’s consider an example of a fictional company, ABC Inc. Below are simplified balance sheets for ABC Inc. for the years 2020 and 2021:
2020:
– Total Assets: $1,000,000
– Total Liabilities: $500,000
– Total Equity: $500,000
2021:
– Total Assets: $1,200,000
– Total Liabilities: $600,000
– Total Equity: $600,000
By comparing these balance sheets, stakeholders can see that ABC Inc. has experienced growth in both assets and equity from 2020 to 2021. However, the company’s liabilities have also increased, which may raise concerns about its long-term financial health.
Tips for Successful Analysis of Yearly Comparison Balance Sheets
When analyzing yearly comparison balance sheets, stakeholders should keep the following tips in mind to ensure a thorough and accurate assessment of the company’s financial health:
– Regularly review and compare balance sheets from multiple periods to identify trends and patterns.
– Pay attention to key financial ratios to assess the company’s liquidity, profitability, and solvency.
– Seek professional advice from financial experts or accountants to interpret complex financial data accurately.
– Consider external factors such as economic conditions, industry trends, and regulatory changes that may impact the company’s financial performance.
By following these tips, stakeholders can effectively use yearly comparison balance sheets to make informed decisions and support the long-term success of the company.
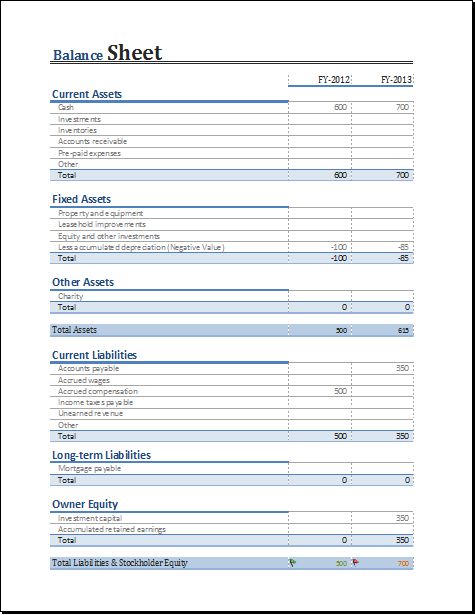
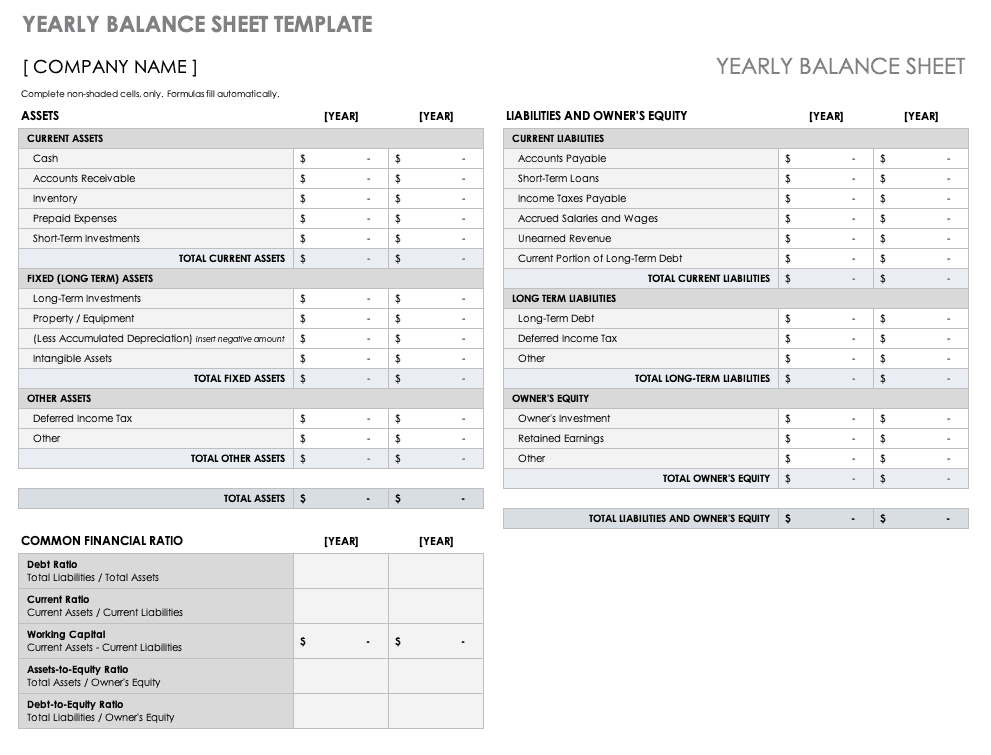
Yearly Comparison Balance Sheet Template – Download
